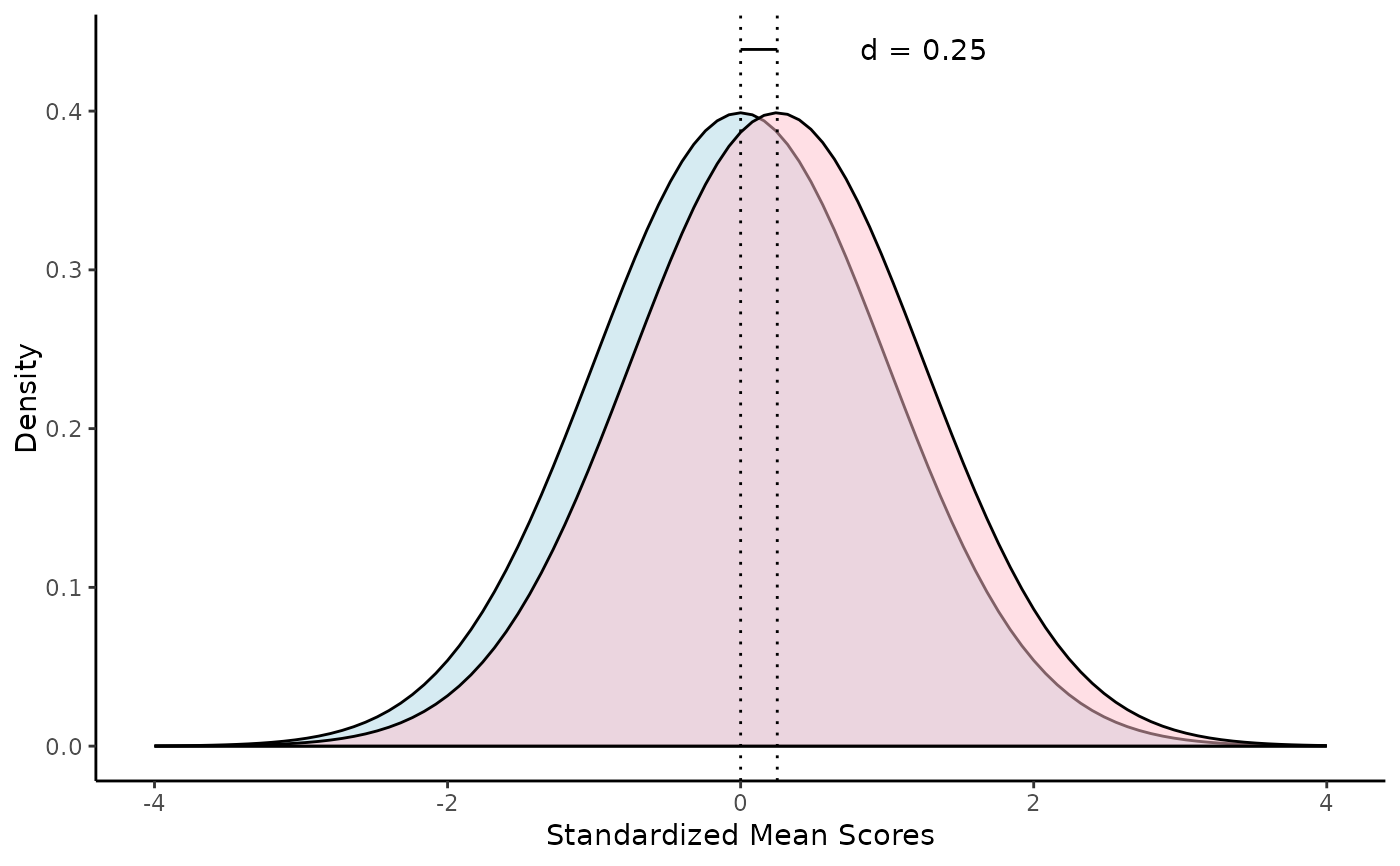
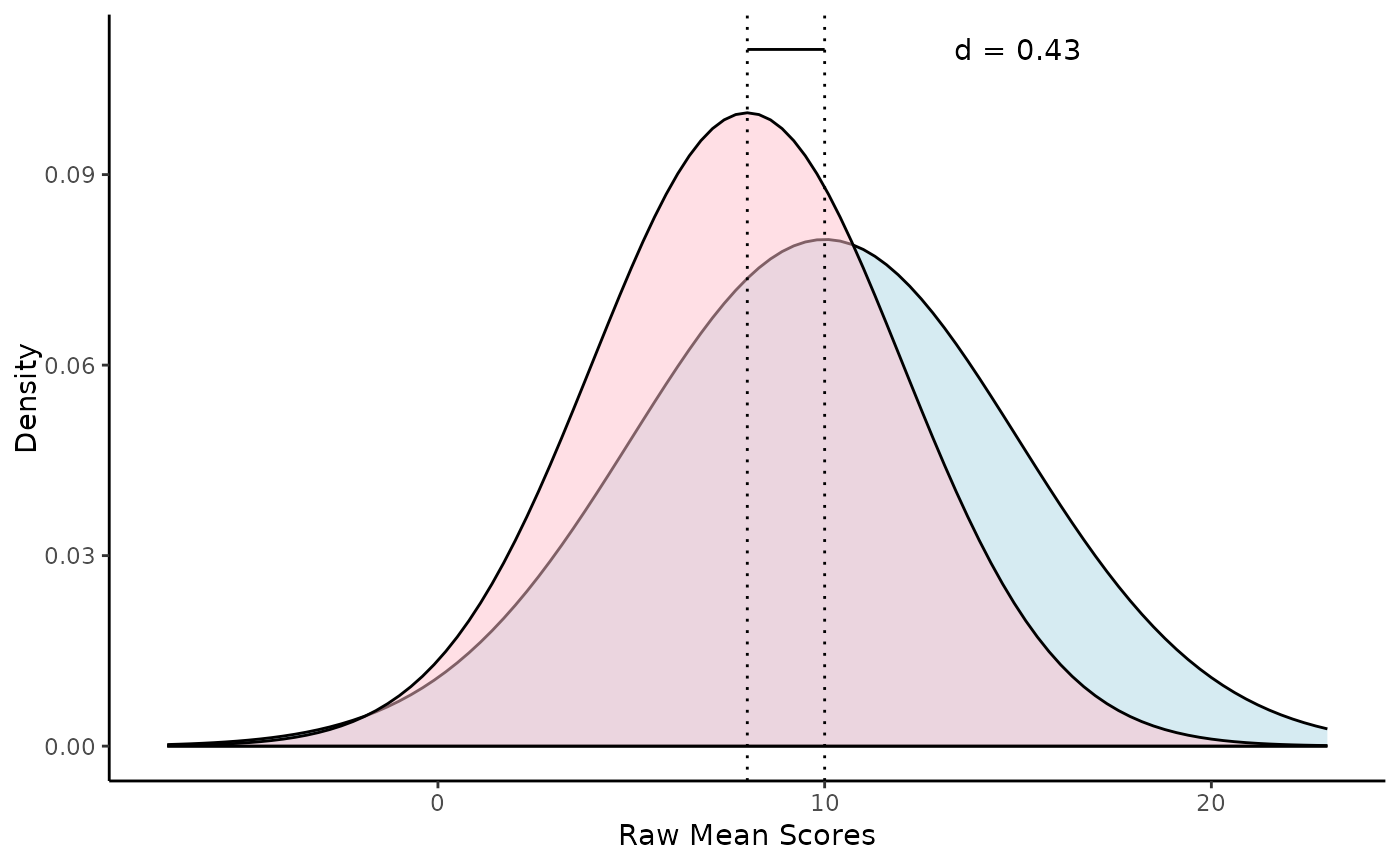
Visualization for Estimating \(d_s\)
estimate_d.RdThis function displays a visualization of effect sizes.
Usage
estimate_d(
  m1 = NULL,
  m2 = NULL,
  sd1 = NULL,
  sd2 = NULL,
  n1 = NULL,
  n2 = NULL,
  d = NULL,
  fill_1 = "lightblue",
  fill_2 = "pink",
  text_color = "black"
)
Arguments
- m1
mean from first group
- m2
mean from second group
- sd1
standard deviation from first group
- sd2
standard deviation from second group
- n1
sample size for first group
- n2
sample size for the second group
- d
estimate of the effect size
- fill_1
a color code or name to fill the first distribution
- fill_2
a color code or name to fill the second distribution
- text_color
a color code or name for the graph text

